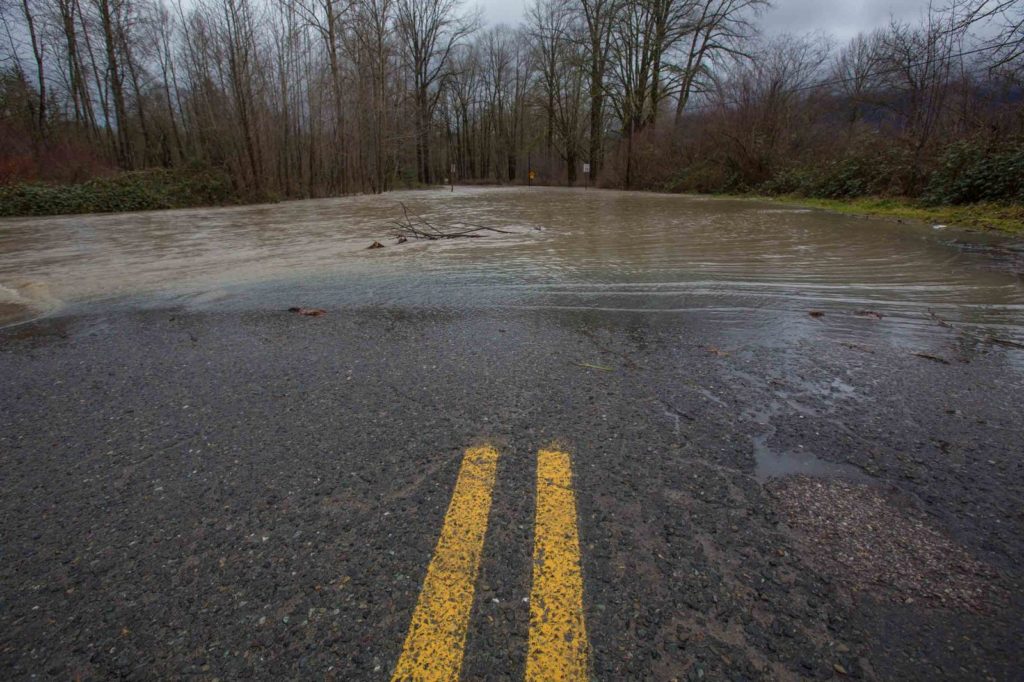
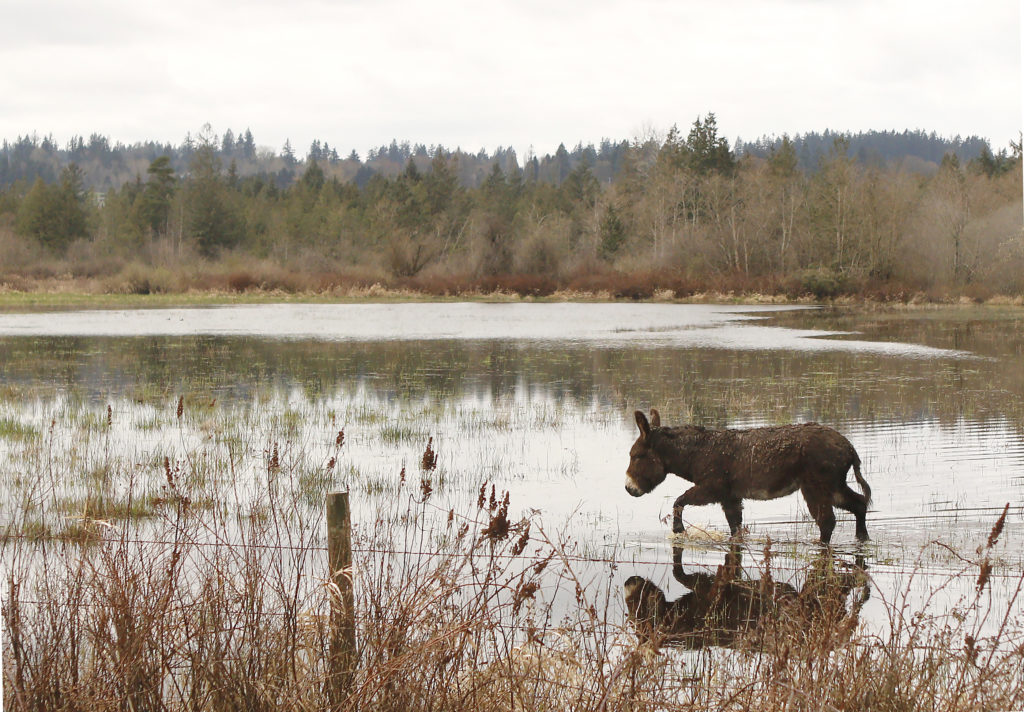
Imagine you’re a third-generation farmer in the Puget Sound. You’ve seen changes around your farm for years — neighboring farms disappear to urban sprawl and development, the farm store down the road is gone and it’s hard to get onto your field in the spring to plant your crops because there is still water.
You’re witnessing more rain and wetter fields in the spring, which delays your time to plant your crops and you are battling hotter and drier summers. With all this, how can your farm stay profitable — not just for you but for your kids and their kids?
In 2017, the Snohomish Conservation District chose to tackle this question partly by providing a planning toolset to help farmers plan for future changes and risks. Input from local farmers and a partnership between the conservation district, University of Washington Climate Impacts Group and The Nature Conservancy has now produced a new mapping tool that allows farmers to see modeled results of flood risk (both extent and depth) in Snohomish County during the 1980s, 2050s and 2080s.
The Nature Conservancy’s Jamie Robertson noted, “Maybe most important, the model results tell us more common flood events in the future will likely resemble the less common large flood events of the past. We want farmers to have easy access to this information so they can better understand their flood risks and develop strategies they can implement today that will maintain their own farm’s economic viability well into the future.”
The mapped information is now available as a publicly available web app through the Coastal Resilience website. This simple tool lets farmers easily view the maps that interest them via a combination of the flood factors. They can zoom in, move around and click on any location for the water depth in feet. Get started by clicking on the Flood and Sea Level Rise app. There, you’ll also find a link to UW Climate Impact Group’s technical report describing the flood modeling process.
Here’s a sneakpeak showing one area where a flood that’s likely to only occur every two years in the 2050s (right image in the slider) will cover whole fields that would have stayed dry back in the 1980s (left). Darker areas indicate deeper water:


